During my summer after junior year, I created a truck routing tool for GrubTubs, Inc using React and Node.js. The tool turned routing from an hour-long task into a five-minute one, freeing up the Operations Manager to do his other tasks. Customer usage information was also pulled from an external resource and made available to the billing system via an API endpoint. This allowed automatic billing of overage fees. I also developed a clustering algorithm that geographically grouped their customers and assigned them service days in order to minimize driving distances, which had not been done before.
How I ended up in Austin
During my spring 2019 semester abroad in Copenhagen, I came across GrubTubs while working on a class project. I was enamored of the method GrubTubs was using to convert food waste into animal feed, and I wanted to learn more. I’d also heard a podcast in which the founder and CEO, Robert Olivier, mentioned briefly their need for logistics software. So I connected with Robert on LinkedIn and, after a series of back-and-forth messages, calls, and emails, I had a job offer. So I hopped in my car and left the mild weather of northern California for the unrelenting heat of Texas.
The previous state of affairs
I won’t go into the details of the operations, but suffice it to say it involved a lot of manual work. There were multiple sources of the same information, and lots of double-checking was needed to minimize errors. It was far from optimal.
The new routing system
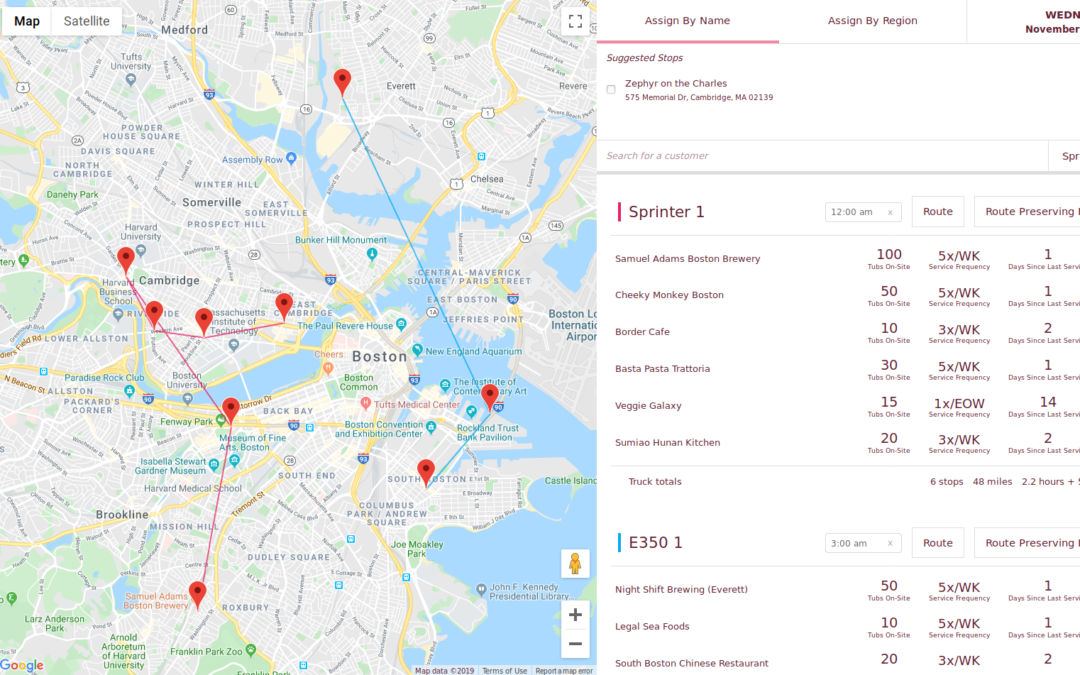
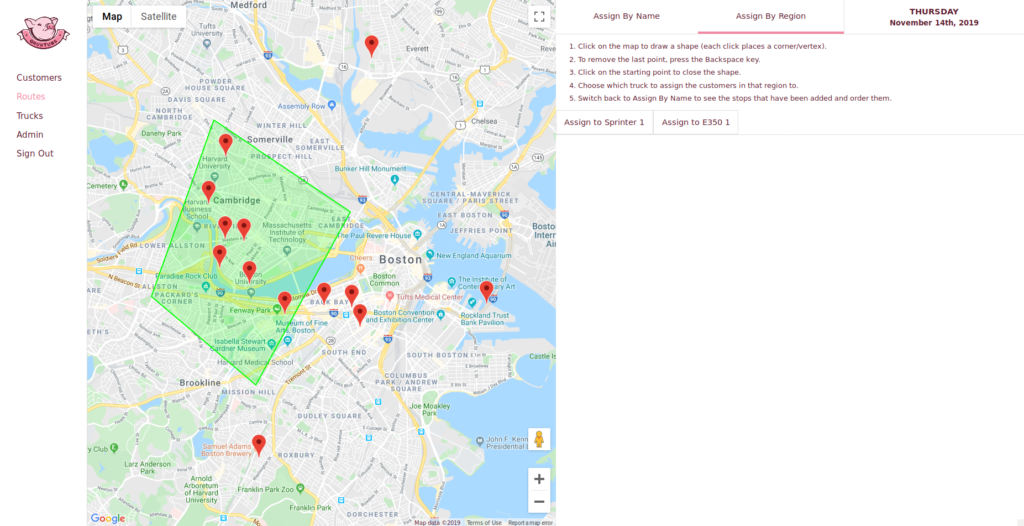
After sitting down with the Operations Manager and gathering his list of wishes, I proposed a solution that would place all of the day’s customers on a map and allow him to visually assign them to collection trucks by region. The unordered list of customers would then be ordered using the Google Maps Directions API and distance and time estimates would be shown.
(All app screenshots display dummy data.)
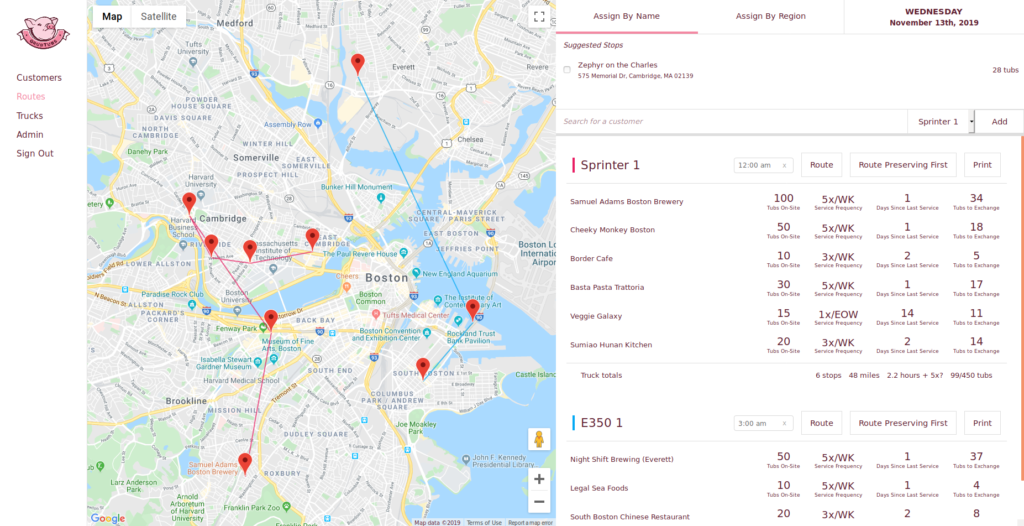
Customer information was pulled from HubSpot (authenticated using OAuth) and stored in a MongoDB database. Customer usage data was also pulled from another external resource and stored in the MongoDB database. This enabled my system to realize when customers were not service despite being scheduled, to provide estimates for the total tubs to be collected on a route, to automatically provide the billing software with each customer’s usage data, and to automatically calculate overage fees (all previously manual tasks).
The app also featured a mobile-friendly page for viewing customers, their addresses, their location on a map (with a movable marker to tell drivers exactly where to go), and their service history with usage data. All of this information was previously strewn across multiple services (or not at all, in the case of the map markers).
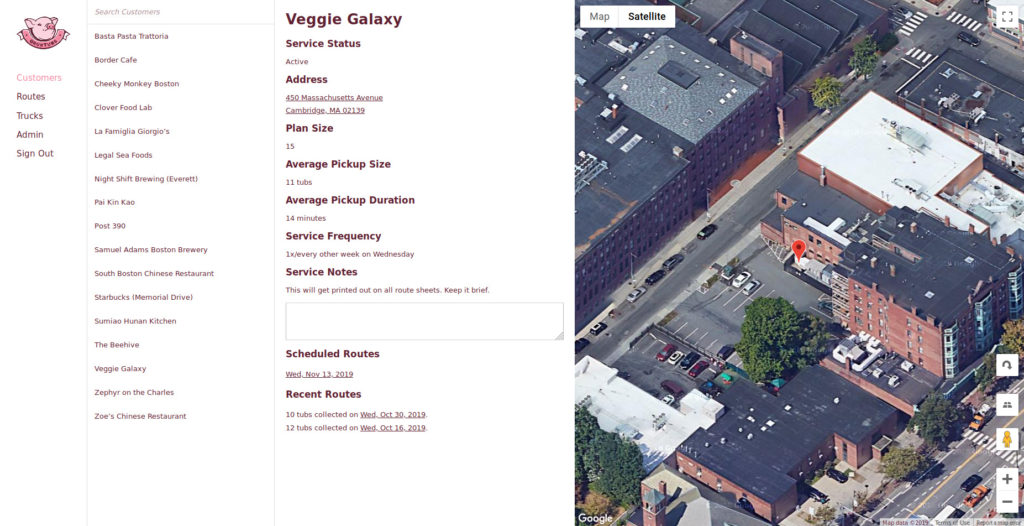
Users logged in with their GrubTubs GSuite accounts, and permissions could be controlled so that the administrators, salespersons, and drivers could all access and edit the appropriate information.
Optimizing collections
At GrubTubs, the days on which customers were serviced was determined somewhat arbitrarily. As more customers were added, they were simply allocated to a day and a truck that had capacity. It worked, but a lack of geographic clustering made it far from optimal.
In an attempt to make this better, I created a Python script that would allocate customers to service days while considering service frequency and geographic location. Its goal was to minimize distance traveled, and it used a form of graph coloring to do this.
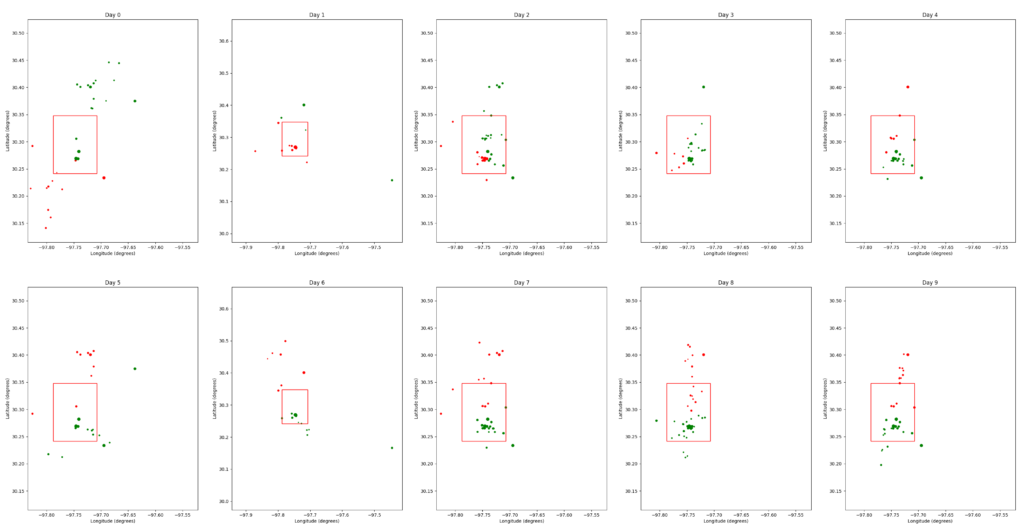
I provided management with the output of this clustering algorithm, but they had yet to use it by the time I departed.
Takeaways
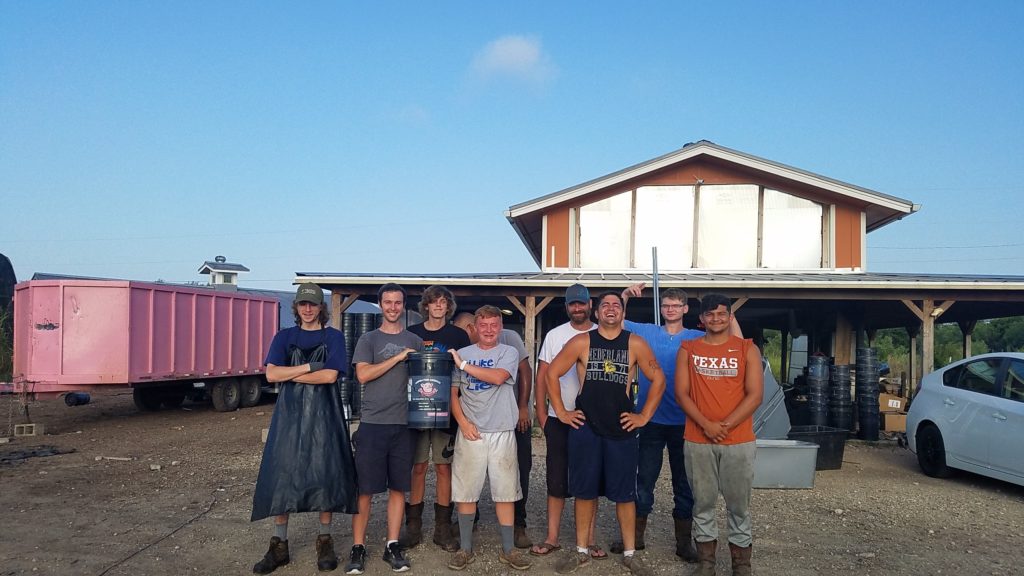
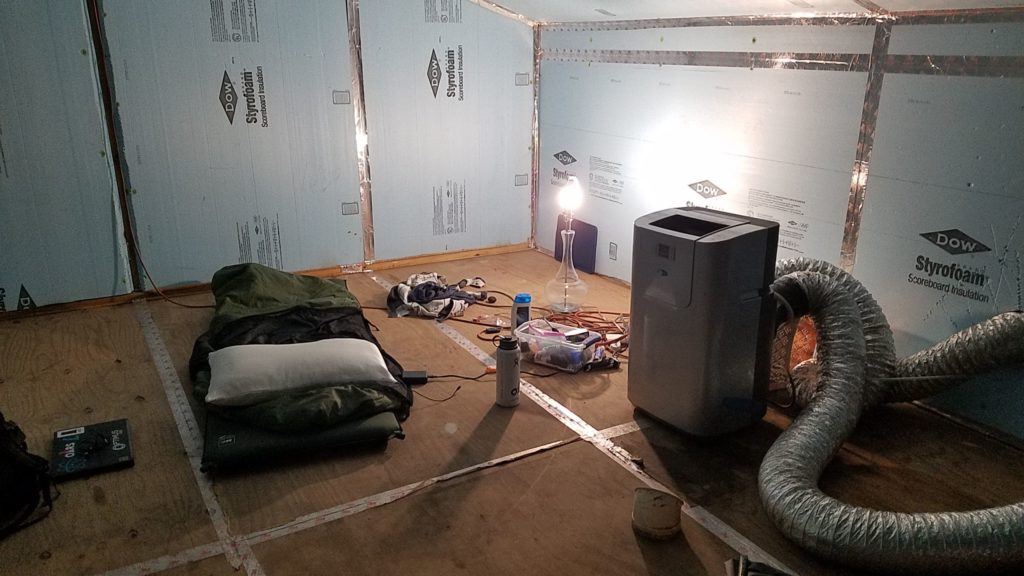
My time in Austin was an experience I’ll never forget. Even though I lived on the farm and slept in a loft on a camping pad next to my air conditioner the whole time, I don’t regret the decision one bit.
It was an incredible opportunity to work right alongside the people my tool was helping, and to see the excitement and enthusiasm on the Operations Manager’s face when he tried out new features of my app. Everything I did felt incredibly worthwhile because I knew no one else would do it if it weren’t for me, and I could see the direct effects of freeing people from laborious tasks. Even though I’m not going back, it’s become the gold standard for an employment experience.